Observability Engineering - Achieving Production Excellence
My personal notes on the book Observability Engineering: Achieving Production Excellence.
Chapter 1: What is Observability?
Observability = understanding a system’s internal state by examining its external outputs. If you can understand any bizarre or novel state without needing to ship new code, you have observability.
Key differences from monitoring:
- Monitoring answers known questions (predefined metrics/dashboards)
- Observability answers unknown questions (exploratory debugging of novel problems)
The Three Pillars (Legacy Model)
- Metrics: aggregated numeric data
- Logs: discrete events
- Traces: request paths through distributed systems
Problem with pillars: Each addresses a specific question type, requiring context-switching between tools. Not sufficient for modern complexity.
Modern Observability Requirements
- High cardinality: ability to query across many dimensions
- High dimensionality: rich context in every event
- Explorability: iterative investigation without predefined queries
Core principle: Instrument once, ask any question later.
Chapter 2: Debugging Pre- vs Post-Production
Pre-Production Debugging
- Controlled environment
- Reproducible issues
- Step-through debuggers, breakpoints
- Small data sets
Post-Production Debugging
- Live user traffic - can’t pause or reproduce
- Scale complexity - millions of requests, distributed systems
- Unknown unknowns - novel failures you didn’t anticipate
- Time pressure - every minute affects users/revenue
Key insight: Traditional debugging tools (debuggers, profilers) don’t work in production. Need observability to understand system state without disrupting it.
The Production Debugging Loop
- Notice problem (alert, user report)
- Form hypothesis
- Query telemetry data
- Refine hypothesis
- Repeat until root cause found
Speed matters: The faster you can iterate through this loop, the faster you resolve incidents.
Chapter 3: Lessons from Scaling Without Observability
Common Anti-Patterns
Metrics overload: Creating metrics for everything results in:
- Overwhelming dashboards (hundreds of graphs)
- High cardinality explosion (storage costs)
- Still can’t answer unexpected questions
Alert fatigue: Too many alerts lead to:
- Ignoring/silencing important alerts
- Desensitization to pages
- Missing critical issues
Dashboard proliferation:
- One dashboard per service/team
- No one knows which to check
- Stale/unmaintained dashboards
What Doesn’t Scale
- Pre-aggregated metrics - lose detail needed for debugging
- Grep-ing logs - inefficient at scale, requires log shipping/indexing
- Static dashboards - can’t answer new questions
- Tribal knowledge - team members as the “observability layer”
Key Lesson
Without observability, debugging time increases exponentially with system complexity.
Chapter 4: Observability, DevOps, SRE, and Cloud Native
DevOps Connection
Observability enables key DevOps practices:
- Fast feedback loops: quickly see impact of changes
- Shared responsibility: everyone can investigate issues
- Blameless postmortems: data-driven incident analysis
SRE Principles
Observability supports SRE tenets:
- SLIs/SLOs: measure what matters to users
- Error budgets: quantify acceptable failure
- Toil reduction: less manual investigation
Cloud Native Requirements
Modern architectures demand observability:
- Microservices: distributed tracing essential
- Containers: ephemeral infrastructure
- Auto-scaling: dynamic resource allocation
- Polyglot systems: diverse tech stacks
Reality: You can’t SSH into production anymore. Need to understand systems from the outside.
Chapter 5: Observability in the Software Life Cycle
Where Observability Fits
Development:
- Validate features work as intended
- Understand performance characteristics
- Debug integration issues
Testing:
- Performance testing insights
- Identify bottlenecks early
- Validate under load
Deployment:
- Progressive rollouts: compare canary vs production
- Real-time health checks
- Immediate rollback triggers
Production:
- Incident response
- Performance optimization
- Capacity planning
- Business intelligence
Key insight: Observability isn’t just for production - use it throughout the entire lifecycle for faster feedback.
Chapter 6: Observability-Driven Development
The Practice
Write instrumentation before or alongside application code, not as an afterthought.
Benefits
- Better understanding: forces you to think about what matters
- Faster debugging: instrumentation ready when you need it
- Validates assumptions: see if code behaves as expected
- Documentation: telemetry shows how system actually works
What to Instrument
- Business logic: user actions, feature usage
- Performance: latency, resource usage
- Errors: failure modes, edge cases
- Dependencies: external service calls
- State changes: critical transitions
Anti-Pattern
Don’t just instrument technical metrics (CPU, memory). Instrument business value and user experience.
Chapter 7: Understanding Cardinality
Definition
Cardinality = number of unique values in a dimension.
Examples:
- HTTP status code: low cardinality (~5-10 values)
- User ID: high cardinality (millions of values)
- Request ID: very high cardinality (unbounded)
Why It Matters
High-cardinality data is essential for observability because:
- Enables precise filtering (find specific user’s request)
- Supports arbitrary grouping
- Answers specific questions, not just aggregates
The Problem
Traditional metrics systems can’t handle high cardinality:
- Metrics per unique combination explode exponentially
- Storage/compute costs become prohibitive
- Systems slow down or crash
The Solution
Use structured events instead of metrics:
- Store raw, detailed events
- Query/aggregate at read time
- Pay for what you actually query
Key equation:
Cardinality = dimension1_values × ... × dimensionN_valuesWith 10 dimensions of 100 values each = 100^10 possible combinations!
Chapter 8: Structured Events as Building Blocks
- An event is a rich, wide data structure representing a single unit of work (request, transaction, operation).
- A structured event is a comprehensive record of a request’s lifecycle in a service, created by:
- Starting with an empty map when the request begins
- Collecting key data throughout the request’s duration (including IDs, variables, headers, parameters, timing, and external service calls)
- Formatting this information as searchable key-value pairs
- Capturing the complete map when the request ends or errors
Example structure:
{
  "timestamp": "2024-01-15T10:30:45Z",
  "duration_ms": 234,
  "user_id": "user_12345",
  "endpoint": "/api/checkout",
  "status_code": 200,
  "item_count": 3,
  "total_amount": 89.99,
  "payment_method": "credit_card",
  "region": "us-west",
  "version": "v2.3.1"
}
Advantages Over Metrics/Logs
vs Metrics:
- No pre-aggregation loss
- Query any dimension combination
- Retain full detail
vs Logs:
- Structured (easily queryable)
- Consistent format
- Efficient storage/querying
Best Practices
- One event per unit of work (not multiple logs)
- Include context (user, session, trace IDs)
- Add metadata (version, region, host)
- Record outcomes (success, error codes, duration)
Traces
- Distributed traces are an interrelated series of events. In an observable system, a trace is simply a series of interconnected events.
- Tracing is a fundamental software debugging technique wherein various bits of information are logged throughout a program’s execution for the purpose of diagnos‐ ing problems.
- Distributed tracing is a method of tracking the progression of a single request - called a trace - as it is handled by various services that make up an application.
- What we want from a trace: to clearly see relationships among various services.
- To quickly understand where bottlenecks may be occurring, it’s useful to have waterfall-style visualizations of a trace. Each stage of a request is displayed as an individual chunk in relation to the start time and duration of a request being debugged.
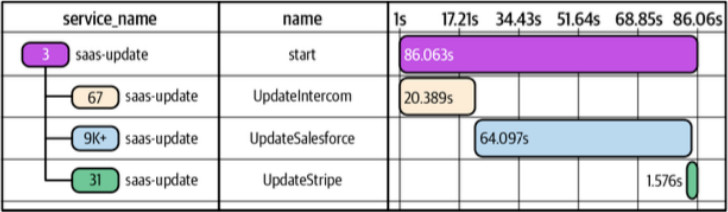
- Each chunk of this waterfall is called a trace span, or span for short. Within any given trace, spans are either the root span - the top-level span in that trace - or are nested within the root span. Spans nested within the root span may also have nested spans of their own. That relationship is sometimes referred to as parent-child.
- To construct the view we want for any path taken, no matter how complex, we need five pieces of data for each component:
- Trace ID: a unique identifier for the trace so that we can map it back to a particular request. This ID is created by the root span and propagated throughout each step taken to fulfill the request.
- Span ID: a unique identifier for each individual spa. Spans contain information captured while a unit of work occurred during a single trace.
- Parent Span ID: used to properly define nesting relationships throughout the life of the trace.
- Timestamp: each span must indicate when its work began.
- Duration: each span must record how long that work took to finish.
- Other fields may be helpful when identifying these spans - any additional data added to them is essentially a series of tags. Service Name and Span Name are good examples of common tags.
- To quickly understand where bottlenecks may be occurring, it’s useful to have waterfall-style visualizations of a trace. Each stage of a request is displayed as an individual chunk in relation to the start time and duration of a request being debugged.
- When handling a request in a service, we would start a trace in the root span, and forward its IDs in via HTTP headers to other services, such as the
X-B3-TraceIdand theX-B3-ParentSpanIdheaders. In the called services, we would extract these headers to generate their own trace and spans. On the backend, those traces are stitched together to create the waterfall-type visualization we want to see. - A common scenario for a nontraditional use of tracing is to do a chunk of work that is not distributed in nature, but that you want to split into its own span for a variety of reasons, such as tracking performance and resources usage.
Chapter 9: How Instrumentation Works
Instrumentation Approaches
1. Manual Instrumentation
- Explicitly add telemetry in code
- Full control over data collected
- More effort, but most flexible
2. Auto-Instrumentation
- Framework/library generates telemetry automatically
- Fast to deploy
- Less control over data
3. Hybrid
- Auto-instrument framework operations
- Manually instrument business logic
- Recommended approach
What to Capture
Technical telemetry:
- Request/response details
- Database queries
- External API calls
- Errors and exceptions
Business telemetry:
- User actions
- Feature usage
- Conversion events
- Business outcomes
Context propagation:
- Trace IDs
- User IDs
- Session IDs
- Feature flags
Sampling Strategies
Head-based sampling: Decide at request start
- Simple to implement
- May miss interesting traces
Tail-based sampling: Decide after request completes
- Can keep all errors
- More complex to implement
- Preferred for observability
Dynamic sampling: Adjust based on load/value
- Sample less interesting requests more aggressively
- Always keep errors, slow requests
Chapter 10: Instrumentation with OpenTelemetry
- OTEL is a vendor-neutral standard for collecting telemetry data.
- OTel captures traces, metrics, logs, and other telemetry data and lets you send it to the backend of your choice. Core concepts:
- API: the specification portion of OTel libraries.
- SDK: the concrete implementation of OTel.
- Tracer: a component within the SDK that is responsible for tracking which span is currently active in your process.
- Meter: a component within the SDK that is responsible for tracking which metrics are available to report in your process.
- Context Propagation: a part of the SDK that deserializes context about the current inbound request from headers such as
TraceContextorB3M, and passes it to downstream services. - Exporter: a plugin that transforms OTel in-memory objects into the appropriate format for delivery to a specific destination.
- Collector: a standalone process that can be run as a proxy or sidecar and that receives, processes and tees telemetry data to one or more destinations.
- Start with automatic instrumentation to decrease friction, i.e. use built-in functions (e.g. from the Go package) or bundles like the Symfone one
FriendsOfOpenTelemetry/opentelemetry-bundle. - Once you have automatic instrumentation, you can start attaching fields and rich values to the auto-instrumentated spans inside your code.
Chapter 11: Analyzing Events for Observability
The Debugging Workflow
1. Start broad:
- What’s the overall pattern? (error rate, latency distribution)
- Which dimension stands out? (region, version, user tier)
2. Iteratively narrow:
- Filter to interesting subset
- Group by suspected dimension
- Compare to baseline/expected
3. Find outliers:
- Identify anomalous values
- Drill into specific examples
- Examine full event detail
4. Form and test hypotheses:
- What could cause this pattern?
- Query to confirm/refute
- Repeat until root cause found
Essential Query Patterns
Filtering:
- Isolate specific requests:
WHERE status_code >= 500 - Time windows:
WHERE timestamp > now() - 1h
Grouping:
- Aggregate by dimension:
GROUP BY endpoint - Find distribution:
COUNT(*) GROUP BY status_code
Statistical analysis:
- Percentiles:
P50(duration_ms),P99(duration_ms) - Heatmaps: duration distribution over time
- Counts: error rates, throughput
Comparison:
- Before/after deployment
- Canary vs production
- Success vs failure
Advanced Techniques
BubbleUp: Automatically finds dimensions that differ between two groups
- Compare error vs success requests
- System highlights differentiating fields
- Quickly identifies root cause
High-Cardinality Exploration:
- Find specific user’s bad experience
- Identify problem with single customer
- Debug edge cases
Trace Analysis:
- Follow request through system
- Identify slow components
- Understand dependencies
Key Principles
Think in dimensions, not dashboards:
- Don’t rely on pre-built views
- Explore data interactively
- Follow where the data leads
Keep context:
- Always connect telemetry to user impact
- Understand business implications
- Prioritize based on value
Iterate quickly:
- Fast query responses enable exploration
- Don’t wait for batch processing
- Real-time feedback loop
Chatper 12: Using Service-Level Objectives for Reliability
- In monitoring-based approaches, alerts often measure the things that are easiest to measure. These usually don’t produce meaningful alerts for you to act upon.
- Becoming accustomed to alerts that are prone to false positives is a known problem and a dangerous practice - it is known as normalization of deviance. In the software industry, the poor signal-to-noise ratio of monitoring-based alerting often leads to alert fatigue.
- Threshold alerting is for known-unknowns only: in a distributed system with hundreds or thousands of components serving production traffic, failure is inevitable. Failures that get automatically remediated should not trigger alarms.
- The Google SRE book indicates that a good alert must reflect urgent user impact, must be actionable, must be novel, and must require investigation rather than rote action.
- Service-level objectives (SLOs) are internal goals for measurement of service health.
- SLOs quantify an agreed-upon target for service availability, based on critical end-user journeys rather than system metrics. That target is measured using service-level indicators (SLIs), which categorize the system state as good or bad.
- Time-based measures: “99th percentile latency less than 300 ms over each 5-minute window”
- Event-based measures: “proportion of events that took less than 300 ms during a given rolling time window”
- Example of event-based SLI: a user should be able to successfully load your home page and see a result quickly. The SLI should do the following:
- Look for any event with a request path of /home.
- Screen qualifying events for conditions in which the event duration < 100 ms.
- If the event duration < 100 ms and was served successfully, consider it OK.
- If the event duration > 100 ms, consider that event an error even if it returned a success code.
- SLOs narrow the scope of your alerts to consider only symptoms that impact what the users of our service experience. However, there is no correlation as to why and how the service might be degraded. We simply know that something is wrong.
- Decoupling “what” from “why” is one of the most important distinctions in writing good monitoring with maximum signal and minimum noise.
13. Acting on and Debugging SLO-Based Alerts
- An error budget represents that maximum amount of system unavailability that your business is willing to tolerate. If your SLO is to ensure that 99.9% of requests are successful, a time-based calculation would state that your system could be unavailable for no more than 8 hours, 45 minutes, 57 seconds in one standard year.
- An event-based calculation considers each individual event against qualification criteria and keeps a running tally of “good” events versus “bad”.
- Subtract the number of failed (burned) requests from your total calculated error budget, and that is known colloquially as the amount of error budget remaining.
- Error budget burn alerts are designed to provide early warning about future SLO violations that would occur if the current burn rate continues.
- The first choice to analyze SLO is whether you want to use a fixed window (e.g. from the 1st to the 30th day of the month) or a sliding window (e.g. the last 30 days).
- With a timeframe selected, you can now set up a trigger to alert you about error budget conditions you care about. The easiest alert to set is a zero-level alert - one that triggers when your entire error budget is exhausted. Once your budget is spent, you need to stop working on new features and work toward service stability.
- A SLO burn alert is an alert triggered when an error budget is being depleted faster than is sustainable for a given Service Level Objective (SLO). In general, when a burn alert is triggered, teams should initiate an investigative response.
- Rather than making aggregate decisions in the good minute / bad minute scenario, using event data to calculate SLOs gives you request-level granularity to evaluate system health.
- Example: instead of checking if the system CPU or RAM is above a threshold, we can check the request duration for every individual request, and discover a pattern that affects our SLO (e.g. network issue when communicating with the database, which would not be covered by the previous “known-unknown” alerts).
- Observability data that traces actual user experience with your services is a more accurate representation of system state than coarsely aggregated time-series data.
Key Takeaways
- Observability ≠ Monitoring: Observability answers unknown questions; monitoring answers known ones
- High cardinality is essential: Must support arbitrary dimensions for modern debugging
- Structured events > Metrics + Logs: Rich, wide events provide necessary context
- Instrument early: Add observability during development, not as afterthought
- OpenTelemetry: Use standards for portability and future-proofing
- Explore iteratively: Debug by following the data, not predefined dashboards
- Speed matters: Faster debugging loops = faster incident resolution = better user experience